


Statistics can often be misleading, here's an example. Take the number of billionaires in ten countries:
💰 United States - 585
💰 China - 476
💰 India - 131
💰 Germany - 114
💰 Russia - 98
💰 Hong Kong - 67
💰 Canada - 64
💰 United Kingdom - 54
💰 Brazil - 43
💰 Italy - 42
From this list, we can safely say that the US is clearly leading here, or can we? This number is not showing reality because the underlying comparison, billionaires to nr. of people is different in each country.
Normalizing the basis to compare to, let's say, per million people would be a much better metric because every country on the list above has at least a million citizens.
The list below shows this:
👉 Hong Kong ~8.93
👉 Canada ~1.70
👉 US ~1.6
👉 Germany ~1.37
👉 United Kingdom ~0.81
👉 Italy ~0.69
👉 Russia ~0.67
👉 China ~0.3
👉 Brazil ~0.19
👉 India ~0.09
This list shows a totally different picture. We compared two dimensions normalizing one to the other and calculated the average.
Another case where averaging can be misleading is employee salaries and the national or company-wide average, which is not a very accurate metric simply because if we take five employees in a company with the following salaries:
👶 Employee 1 - 5,000.00 USD / month
👶 Employee 2 - 5,500.00 USD / month
👶 Employee 3 - 6,000.00 USD / month
👶 Employee 4 - 12,000.00 USD / month
👶 Employee 5 - 14,000.00 USD / month
On average we could say that an employee has 8,500.00 USD / month. Employee 1 wouldn't agree.
A better metric would be the median salary, which is considered a more neutral measure and it's 6,000.00 USD / month.
So, next time you interview for a job and the HR person says "Oh yeah, our employees get around X amount of USD per month" you should ask if it's on average or median? 😁
A wonderfully elegant yet horrible metric is lines of code in a codebase. It's wonderful because it's straightforward, it's a number everybody can understand, one project has 100.000 LoC another project has 20.000 LoC, therefore, the former is bigger than the latter.
Yet it's a horrible metric because managers often use it to measure developer productivity.
Why is that? Well, a program can be written in an infinite amount of ways, one developer can write a function in 5 lines another can write it in 25 lines. Which is better?
Also, the process of writing code differs from let's say writing this blog post. A developer can write 1000 lines of code, deleting 300, and modifying the rest to be under 500 LoC.
Or, one project can adhere to one type of coding style another to a different one, for example, the same exact code can be written in four different ways:
Ten lines:
console.log(1);
console.log(2);
console.log(3);
console.log(4);
console.log(5);
console.log(6);
console.log(7);
console.log(8);
console.log(9);
console.log(10);
Three lines:
for ( let i = 0; i < 10; i++ ) {
  console.log(i);
}
Four lines:
for ( let i = 0; i < 10; i++ )
{
  console.log(i);
}
One line:
for ( let i = 0; i < 10; i++ ) { console.log(i); }
Using lines of code as a blanket statistic to measure productivity is horrible but if a manager uses this metric, by logic, the developer who wrote it in ten lines is the most productive.
Developer productivity is a really complex metric, there's no single truth, but we can employ a variety of other strategies such as:
- The number of bugs QA caught after a feature was implemented.
- Effort of feature vs. time of development.
- Time and effort of peer reviews.
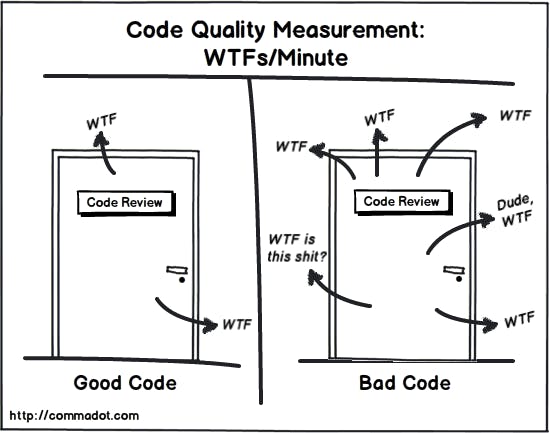
In the end, WTF/minute is a better metric than LoC. 🙃
Cover photo by charlesdeluvio
I hope you enjoyed this article, if you like it, please consider sharing, it would help the blog greatly. If you have any questions you can ask here in the comments section below or @ me on Twitter.